Find tracks#
Show code cell source
from __future__ import annotations

from collections.abc import Callable, Iterable
from inspect import Signature

from boilercv_dev.docs.nbs import get_mode, init
from boilercv_pipeline.dfs import limit_group_size
from boilercv_pipeline.models.column import Col, LinkedCol, convert, rename
from boilercv_pipeline.models.deps import get_slices
from boilercv_pipeline.models.df import GBC
from boilercv_pipeline.models.params.types import DfOrS_T
from boilercv_pipeline.models.path import get_datetime
from boilercv_pipeline.models.subcool import const
from boilercv_pipeline.palettes import cat10, cool
from boilercv_pipeline.plotting import get_cat_colorbar
from boilercv_pipeline.sets import inspect_video, load_video
from boilercv_pipeline.stages import find_objects, get_thermal_data
from boilercv_pipeline.stages.find_tracks import FindTracks as Params
from boilercv_pipeline.units import U
from devtools import pprint
from matplotlib.axes import Axes
from matplotlib.figure import Figure
from matplotlib.pyplot import subplot_mosaic, subplots
from more_itertools import one, only
from numpy import diff, gradient, linalg, log10, logspace, pi, vectorize
from pandas import DataFrame, Series, melt, merge_ordered, read_hdf
from seaborn import lineplot, scatterplot
from trackpy import link, quiet

from boilercv.correlations import GROUPS
from boilercv.correlations import beta as correlations_beta
from boilercv.correlations import nusselt as correlations_nusselt
from boilercv.correlations.types import Corr
from boilercv.data import FRAME, TIME
from boilercv.dimensionless_params import (
    fourier,
    jakob,
    kinematic_viscosity,
    nusselt,
    prandtl,
    reynolds,
    thermal_diffusivity,
)
from boilercv.images import scale_bool

quiet()

PARAMS = None
"""Notebook stage parameters."""
MODE = get_mode()
"""Notebook execution mode."""
PREVIEW_FRAME_COUNT = 50
"""Number of preview frames."""
Params.hide()
Show code cell source
if isinstance(PARAMS, str):  # pyright: ignore[reportUnnecessaryIsInstance]
    params = Params.model_validate_json(PARAMS)
elif MODE == "docs":
    PREVIEW_FRAME_COUNT = 10
    params = Params(
        context=init(mode=MODE),
        include_patterns=const.nb_include_patterns,
        slicer_patterns=const.nb_slicer_patterns,
    )
else:
    params = Params(context=init(mode=MODE), only_sample=True)
params.set_display_options()
data = params.data
dfs = only(params.dfs)
C = params.cols

thermal = read_hdf(params.deps.thermal)
TC = get_thermal_data.Cols()

slices = get_slices(one(params.filled_slicers))
frames_slice = slices.get(FRAME, slice(None))
objects_path = one(params.objects)
objects = read_hdf(objects_path).set_index(C.frame()).loc[frames_slice, :].reset_index()
frames = objects[C.frame()].unique()
OC = find_objects.Cols()

filled_path = one(params.filled)
with inspect_video(filled_path) as filled:
    step_time = diff(filled[TIME].sel({FRAME: frames})[:2])[0]
    objects = (
        read_hdf(objects_path)
        .set_index(C.frame())
        .loc[frames_slice, :]
        .reset_index()
        .assign(**{
            C.time_elapsed(): lambda df: filled.coords[TIME].sel({
                FRAME: df[C.frame()].values
            })
        })
    )


time = get_datetime(objects_path.stem)
subcooling = thermal.set_index(TC.time())[TC.subcool()][time]
cols_to_link = [C.frame, OC.x_tp, OC.y_tp]

# ! To find (202 - 96)
# %matplotlib widget
# from boilercv_pipeline.sets import get_dataset
# _, ax = subplots()
# ax.imshow(get_dataset("2024-07-18T17-44-35", stage="large_sources")[VIDEO].sel(frame=0))

M_PER_PX = U.convert(3 / 8, "in", "m") / (202 - 96)
# PX_PER_M = 20997.3753
U.define(f"px = {M_PER_PX} m")
U.define(f"frames = {step_time} s")

# Minimum bubble diameters
MIN_BUB_D0 = 10 * M_PER_PX
MIN_BUB_DIAMETER = M_PER_PX

# Physical parameters
LATENT_HEAT_OF_VAPORIZATION = 2.23e6  # J/kg
LIQUID_DENSITY = 960  # kg/m^3
LIQUID_DYNAMIC_VISCOSITY = 2.88e-4  # Pa-s
LIQUID_ISOBARIC_SPECIFIC_HEAT = 4213  # J/kg-K
LIQUID_THERMAL_CONDUCTIVITY = 0.676  # W/m-K
VAPOR_DENSITY = 0.804  # kg/m^3


# Plotting
groups = {C.corr[k](): v for k, v in GROUPS.items() if k in C.corr}
"""Groups for mapping to correlations in data."""
GROUP_DRAW_ORDER = ["Group 2", "Group 4", "Group 3", "Group 1", "Ours"]
"""Order to draw groups."""
GROUP_ORDER = sorted(GROUP_DRAW_ORDER)
"""Order to show groups in legend."""
GROUP_SORTER = vectorize(GROUP_DRAW_ORDER.index)
"""Sorter for groups."""
CORRELATIONS_PALETTE = cat10
"""For plotting one approach."""
TRACKS_PALETTE = cool
"""For plotting the other approach."""
MAX_FOURIER = 0.005
"""Maximum Fourier number to plot."""
MAX_BETA = 1.05
"""Maximum dimensionless bubble diameter to plot."""
MAX_NUSSELT = 1000
"""Maximum Nusselt number to plot."""
TRACKS_ALPHA = 0.1
"""Transparency of the tracks."""
TRACKS_SIZE = 10
"""Size of the tracks."""
MAX_BETA_MAE = 0.2
"""Maximum mean absolute error of beta to plot."""
MAX_NUSSELT_ERR = 12000
"""Maximum mean absolute error of nusselt to plot."""
WIDTH_SCALE = 1.48  # 1.215  # 1.48
"""Width to scale plots by."""
HEIGHT_SCALE = 1.000
"""Width to scale plots by."""


def scale_figure(fig: Figure, width: float = WIDTH_SCALE, height: float = HEIGHT_SCALE):
    """Scale up figure size."""
    fig.set_figwidth(width * fig.get_figwidth())
    fig.set_figheight(height * fig.get_figheight())


def get_delta(df: DataFrame, c: LinkedCol) -> Series[float]:
    """Get position time delta across frames."""
    return df.groupby(C.bub(), **GBC)[[c.source()]].diff().fillna(0) / step_time


# def query_lifetime(df: DataFrame) -> DataFrame:
#     """Filter bubbles by lifetime."""
#     return (
#         df.rename(columns={C.bub_visible(): (temp_name := C.bub_visible.no_unit.name)})
#         .query(f"`{temp_name}` > {MINIMUM_LIFETIME}")
#         .rename(columns={temp_name: C.bub_visible()})
#     )


beta_correlations = correlations_beta.get_correlations()
nusselt_correlations = correlations_nusselt.get_correlations()
constants = {
    "Ja": jakob(
        liquid_density=LIQUID_DENSITY,
        vapor_density=VAPOR_DENSITY,
        liquid_isobaric_specific_heat=LIQUID_ISOBARIC_SPECIFIC_HEAT,
        subcooling=subcooling,
        latent_heat_of_vaporization=LATENT_HEAT_OF_VAPORIZATION,
    ),
    "Pr": prandtl(
        dynamic_viscosity=LIQUID_DYNAMIC_VISCOSITY,
        isobaric_specific_heat=LIQUID_ISOBARIC_SPECIFIC_HEAT,
        thermal_conductivity=LIQUID_THERMAL_CONDUCTIVITY,
    ),
    "alpha": 1.0,
    "pi": pi,
    "liquid_kinematic_viscosity": kinematic_viscosity(
        density=LIQUID_DENSITY, dynamic_viscosity=LIQUID_DYNAMIC_VISCOSITY
    ),
    "liquid_thermal_diffusivity": thermal_diffusivity(
        thermal_conductivity=LIQUID_THERMAL_CONDUCTIVITY,
        density=LIQUID_DENSITY,
        isobaric_specific_heat=LIQUID_ISOBARIC_SPECIFIC_HEAT,
    ),
    "liquid_prandtl": prandtl(
        dynamic_viscosity=LIQUID_DYNAMIC_VISCOSITY,
        isobaric_specific_heat=LIQUID_ISOBARIC_SPECIFIC_HEAT,
        thermal_conductivity=LIQUID_THERMAL_CONDUCTIVITY,
    ),
}


def get_corrs(df: DataFrame, kind: Corr) -> DataFrame:
    """Get correlations."""
    return df.assign(**{
        C.corr[label](): (
            corr.expr(**{
                kwd: value
                for kwd, value in {
                    **constants,
                    "Re_b": df[C.bub_reynolds()],
                    "Re_b0": df[C.bub_reynolds0()],
                    "Fo_0": df[C.bub_fourier()],
                    **({} if kind == "beta" else {"beta": df[C.bub_beta()]}),
                }.items()
                if kwd in Signature.from_callable(corr.expr).parameters
            })
        )
        for label, corr in (
            beta_correlations if kind == "beta" else nusselt_correlations
        ).items()
    })


def get_error(df: DataFrame, kind: Corr, rel: bool = True) -> DataFrame:
    """Get error."""
    corrs = [c() for c in C.corr.values()]
    exp = C.bub_beta() if kind == "beta" else C.bub_nusselt()
    return (
        df.set_index([C.bub_fourier(), C.bub()])[[exp, *corrs]]
        .pipe(
            lambda df: df.assign(**{
                c: abs(df[exp] - df[c]) / (df[c] if rel else 1) for c in corrs
            })
        )
        .reset_index()
    )


def set_group_legend(
    fig: Figure,
    ax: Axes,
    loc="lower center",
    bbox_to_anchor=(0.5, 1.0),
    ncol=6,
    width=WIDTH_SCALE,
    height=HEIGHT_SCALE,
):
    """Set legend for correlation groups."""
    legend = ax.legend(
        [
            {
                lab: h
                for h, lab in zip(*ax.get_legend_handles_labels(), strict=False)
                if "Group" in lab or "Ours" in lab
            }[lab]
            for lab in GROUP_ORDER
        ],
        GROUP_ORDER,
        loc=loc,
        bbox_to_anchor=bbox_to_anchor,
        ncol=ncol,
    )
    for handle in legend.legend_handles:  # pyright: ignore[reportAttributeAccessIssue]
        handle.set_alpha(1.0)
    scale_figure(fig, width=width, height=height)


def preview(
    df: DfOrS_T,
    cols: Iterable[Col] | None = None,
    index: Col | None = None,
    f: Callable[[DfOrS_T], DfOrS_T] | None = None,
    ncol: int = 0,
) -> DfOrS_T:
    """Preview a dataframe in the notebook."""
    # fmt: off
    if df.empty:
        display(df)
        return df
    if isinstance(df, Series):
        def _f(df): return (f(df) if f else df).head(16)
    elif C.bub() in df.columns:
        def _f(df): return (_df := f(df) if f else df).groupby(C.bub(), **GBC)[_df.columns].head(4).head(16)  # pyright: ignore[reportRedeclaration]
    else:
        def _f(df): return (f(df) if f else df).head(4).head(16)
    # fmt: on
    df = params.preview(cols=cols, df=df, index=index, f=_f, ncol=ncol)  # pyright: ignore[reportArgumentType]
    return df


pprint(params)
Show code cell output
FindTracks(
context={
'boilercv_pipeline': BoilercvPipelineContext(
roots=Roots(
data=PosixPath('/home/runner/work/boilercv/boilercv/docs/data'),
docs=PosixPath('/home/runner/work/boilercv/boilercv/docs'),
),
kinds={},
track_kinds=False,
),
},
deps=Deps(
context={
'boilercv_pipeline': BoilercvPipelineContext(
roots=Roots(
data=PosixPath('/home/runner/work/boilercv/boilercv/docs/data'),
docs=PosixPath('/home/runner/work/boilercv/boilercv/docs'),
),
kinds={},
track_kinds=False,
),
},
stage=PosixPath('/home/runner/work/boilercv/boilercv/packages/pipeline/boilercv_pipeline/stages/find_tracks'),
nb=PosixPath('/home/runner/work/boilercv/boilercv/docs/notebooks/find_tracks.ipynb'),
filled=PosixPath('/home/runner/work/boilercv/boilercv/docs/data/filled'),
objects=PosixPath('/home/runner/work/boilercv/boilercv/docs/data/e230920/objects'),
thermal=PosixPath('/home/runner/work/boilercv/boilercv/docs/data/e230920/thermal.h5'),
),
outs=Outs(
context={
'boilercv_pipeline': BoilercvPipelineContext(
roots=Roots(
data=PosixPath('/home/runner/work/boilercv/boilercv/docs/data'),
docs=PosixPath('/home/runner/work/boilercv/boilercv/docs'),
),
kinds={},
track_kinds=False,
),
},
dfs=PosixPath('/home/runner/work/boilercv/boilercv/docs/data/e230920/tracks'),
plots=PosixPath('/home/runner/work/boilercv/boilercv/docs/data/e230920/tracks_plots'),
),
scale=1.3,
marker_scale=20.0,
precision=3,
display_rows=12,
data=Data(
context={
'boilercv_pipeline': BoilercvPipelineContext(
roots=Roots(
data=PosixPath('/home/runner/work/boilercv/boilercv/docs/data'),
docs=PosixPath('/home/runner/work/boilercv/boilercv/docs'),
),
kinds={},
track_kinds=False,
),
},
dfs=Dfs(
src=<DataFrame({
})>,
dst=<DataFrame({
})>,
tracks=<DataFrame({
})>,
bubbles=<DataFrame({
})>,
beta=<DataFrame({
})>,
nusselt=<DataFrame({
})>,
beta_err=<DataFrame({
})>,
nusselt_err=<DataFrame({
})>,
),
plots=Plots(
context={
'boilercv_pipeline': BoilercvPipelineContext(
roots=Roots(
data=PosixPath('/home/runner/work/boilercv/boilercv/docs/data'),
docs=PosixPath('/home/runner/work/boilercv/boilercv/docs'),
),
kinds={},
track_kinds=False,
),
},
bubbles=<Figure size 640x480 with 0 Axes>,
multi=<Figure size 640x480 with 0 Axes>,
beta=<Figure size 640x480 with 0 Axes>,
beta_err=<Figure size 640x480 with 0 Axes>,
nusselt_err=<Figure size 640x480 with 0 Axes>,
mae=<Figure size 640x480 with 0 Axes>,
),
),
sample='2024-07-18T17-44-35',
only_sample=False,
include_patterns=[
'^.*2024-07-18T17-44-35.*$',
],
frame_count=0,
frame_step=1,
slicer_patterns={
'.+': {
'frame': Slicer(
start=None,
stop=499,
step=1,
),
},
},
filled=[
PosixPath('/home/runner/work/boilercv/boilercv/docs/data/filled/2024-07-18T17-44-35.nc'),
],
filled_slicers=[
{
'frame': Slicer(
start=None,
stop=499,
step=1,
),
},
],
times=[
'2024-07-18T17-44-35',
],
dfs=[
PosixPath('/home/runner/work/boilercv/boilercv/docs/data/e230920/tracks/tracks_2024-07-18T17-44-35.h5'),
],
cols=Cols(
frame=LinkedCol(
sym='Frame',
unit='',
sub='',
raw='Frame',
fmt='.0f',
source=Col(
sym='frame',
unit='',
sub='',
raw='frame',
fmt=None,
),
latex='$\\mathsf{Frame}$',
),
contour=LinkedCol(
sym='Contour',
unit='',
sub='',
raw='Contour',
fmt='.0f',
source=Col(
sym='contour',
unit='',
sub='',
raw='contour',
fmt=None,
),
latex='$\\mathsf{Contour}$',
),
time_elapsed=Col(
sym='t',
unit='s',
sub='',
raw='t (s)',
fmt=None,
latex='$\\mathsf{t\\ \\left(s\\right)}$',
),
bub=LinkedCol(
sym='Bubble',
unit='',
sub='',
raw='Bubble',
fmt='.0f',
source=Col(
sym='particle',
unit='',
sub='',
raw='particle',
fmt=None,
),
latex='$\\mathsf{Bubble}$',
),
bub_visible_frames=Col(
sym='t',
unit='frames',
sub='b, vis',
raw='t_b, vis (frames)',
fmt='.0f',
latex='$\\mathsf{t_{b, vis}\\ \\left(frames\\right)}$',
),
bub_visible=LinkedCol(
sym='t',
unit='s',
sub='b, vis',
raw='t_b, vis (s)',
fmt=None,
source=Col(
sym='t',
unit='frames',
sub='b, vis',
raw='t_b, vis (frames)',
fmt='.0f',
),
latex='$\\mathsf{t_{b, vis}\\ \\left(s\\right)}$',
),
x=LinkedCol(
sym='x',
unit='m',
sub='',
raw='x (m)',
fmt=None,
source=LinkedCol(
sym='x',
unit='px',
sub='',
raw='x (px)',
fmt=None,
source=Col(
sym='xpx',
unit='',
sub='',
raw='xpx',
fmt=None,
),
latex='$\\mathsf{x\\ \\left(px\\right)}$',
),
latex='$\\mathsf{x\\ \\left(m\\right)}$',
),
y=LinkedCol(
sym='y',
unit='m',
sub='',
raw='y (m)',
fmt=None,
source=LinkedCol(
sym='y',
unit='px',
sub='',
raw='y (px)',
fmt=None,
source=Col(
sym='ypx',
unit='',
sub='',
raw='ypx',
fmt=None,
),
latex='$\\mathsf{y\\ \\left(px\\right)}$',
),
latex='$\\mathsf{y\\ \\left(m\\right)}$',
),
u=LinkedCol(
sym='u',
unit='m/s',
sub='',
raw='u (m/s)',
fmt=None,
source=LinkedCol(
sym='x',
unit='m',
sub='',
raw='x (m)',
fmt=None,
source=LinkedCol(
sym='x',
unit='px',
sub='',
raw='x (px)',
fmt=None,
source=Col(
sym='xpx',
unit='',
sub='',
raw='xpx',
fmt=None,
),
latex='$\\mathsf{x\\ \\left(px\\right)}$',
),
),
latex='$\\mathsf{u\\ \\left(m/s\\right)}$',
),
v=LinkedCol(
sym='v',
unit='m/s',
sub='',
raw='v (m/s)',
fmt=None,
source=LinkedCol(
sym='y',
unit='m',
sub='',
raw='y (m)',
fmt=None,
source=LinkedCol(
sym='y',
unit='px',
sub='',
raw='y (px)',
fmt=None,
source=Col(
sym='ypx',
unit='',
sub='',
raw='ypx',
fmt=None,
),
latex='$\\mathsf{y\\ \\left(px\\right)}$',
),
),
latex='$\\mathsf{v\\ \\left(m/s\\right)}$',
),
diameter=LinkedCol(
sym='d',
unit='m',
sub='',
raw='d (m)',
fmt=None,
source=Col(
sym='d',
unit='px',
sub='',
raw='d (px)',
fmt=None,
latex='$\\mathsf{d\\ \\left(px\\right)}$',
),
latex='$\\mathsf{d\\ \\left(m\\right)}$',
),
radius_of_gyration=LinkedCol(
sym='r',
unit='m',
sub='',
raw='r (m)',
fmt=None,
source=Col(
sym='r',
unit='px',
sub='',
raw='r (px)',
fmt=None,
latex='$\\mathsf{r\\ \\left(px\\right)}$',
),
latex='$\\mathsf{r\\ \\left(m\\right)}$',
),
distance=Col(
sym='z',
unit='m',
sub='',
raw='z (m)',
fmt=None,
latex='$\\mathsf{z\\ \\left(m\\right)}$',
),
bub_time=Col(
sym='t',
unit='s',
sub='b',
raw='t_b (s)',
fmt=None,
latex='$\\mathsf{t_{b}\\ \\left(s\\right)}$',
),
bub_lifetime=Col(
sym='t',
unit='s',
sub='b,tot',
raw='t_b,tot (s)',
fmt=None,
latex='$\\mathsf{t_{b,tot}\\ \\left(s\\right)}$',
),
bub_t0=Col(
sym='t',
unit='s',
sub='b0',
raw='t_b0 (s)',
fmt=None,
latex='$\\mathsf{t_{b0}\\ \\left(s\\right)}$',
),
bub_d0=Col(
sym='d',
unit='m',
sub='b0',
raw='d_b0 (m)',
fmt=None,
latex='$\\mathsf{d_{b0}\\ \\left(m\\right)}$',
),
bub_x0=Col(
sym='x',
unit='m',
sub='b0',
raw='x_b0 (m)',
fmt=None,
latex='$\\mathsf{x_{b0}\\ \\left(m\\right)}$',
),
bub_y0=Col(
sym='y',
unit='m',
sub='b0',
raw='y_b0 (m)',
fmt=None,
latex='$\\mathsf{y_{b0}\\ \\left(m\\right)}$',
),
bub_u0=Col(
sym='u',
unit='m/s',
sub='b0',
raw='u_b0 (m/s)',
fmt=None,
latex='$\\mathsf{u_{b0}\\ \\left(m/s\\right)}$',
),
bub_v0=Col(
sym='v',
unit='m/s',
sub='b0',
raw='v_b0 (m/s)',
fmt=None,
latex='$\\mathsf{v_{b0}\\ \\left(m/s\\right)}$',
),
max_diam=Col(
sym='d',
unit='m',
sub='b,max',
raw='d_b,max (m)',
fmt=None,
latex='$\\mathsf{d_{b,max}\\ \\left(m\\right)}$',
),
diam_rate_of_change=Col(
sym='\\dot{d}',
unit='m/s',
sub='b',
raw='\\dot{d}_b (m/s)',
fmt=None,
latex='$\\mathsf{\\dot{d}_{b}\\ \\left(m/s\\right)}$',
),
bub_reynolds=Col(
sym='Re',
unit='',
sub='b',
raw='Re_b',
fmt=None,
latex='$\\mathsf{Re_{b}}$',
),
bub_reynolds0=Col(
sym='Re',
unit='',
sub='b0',
raw='Re_b0',
fmt=None,
latex='$\\mathsf{Re_{b0}}$',
),
bub_fourier=Col(
sym='Fo',
unit='',
sub='b',
raw='Fo_b',
fmt=None,
latex='$\\mathsf{Fo_{b}}$',
),
bub_nusselt=Col(
sym='Nu',
unit='',
sub='c',
raw='Nu_c',
fmt=None,
latex='$\\mathsf{Nu_{c}}$',
),
bub_beta=Col(
sym='β',
unit='',
sub='',
raw='β',
fmt=None,
latex='$\\mathsf{β}$',
),
corr={
'florschuetz_chao_1965': Col(
sym='Florschuetz and Chao (1965)',
unit='',
sub='',
raw='Florschuetz and Chao (1965)',
fmt=None,
latex='$\\mathsf{Florschuetz\\ and\\ Chao\\ (1965)}$',
),
'florschuetz_chao_fitted_1965': Col(
sym='Fitted Florschuetz and Chao (1965)',
unit='',
sub='',
raw='Fitted Florschuetz and Chao (1965)',
fmt=None,
latex='$\\mathsf{Fitted\\ Florschuetz\\ and\\ Chao\\ (1965)}$',
),
'isenberg_sideman_1970': Col(
sym='Isenberg and Sideman (1970)',
unit='',
sub='',
raw='Isenberg and Sideman (1970)',
fmt=None,
latex='$\\mathsf{Isenberg\\ and\\ Sideman\\ (1970)}$',
),
'akiyama_1973': Col(
sym='Akiyama (1973)',
unit='',
sub='',
raw='Akiyama (1973)',
fmt=None,
latex='$\\mathsf{Akiyama\\ (1973)}$',
),
'chen_mayinger_1992': Col(
sym='Chen and Mayinger (1992)',
unit='',
sub='',
raw='Chen and Mayinger (1992)',
fmt=None,
latex='$\\mathsf{Chen\\ and\\ Mayinger\\ (1992)}$',
),
'zeitoun_et_al_1995': Col(
sym='Zeitoun et al. (1995)',
unit='',
sub='',
raw='Zeitoun et al. (1995)',
fmt=None,
latex='$\\mathsf{Zeitoun\\ et\\ al.\\ (1995)}$',
),
'kalman_mori_2002': Col(
sym='Kalman and Mori (2002)',
unit='',
sub='',
raw='Kalman and Mori (2002)',
fmt=None,
latex='$\\mathsf{Kalman\\ and\\ Mori\\ (2002)}$',
),
'warrier_et_al_2002': Col(
sym='Warrier et al. (2002)',
unit='',
sub='',
raw='Warrier et al. (2002)',
fmt=None,
latex='$\\mathsf{Warrier\\ et\\ al.\\ (2002)}$',
),
'yuan_et_al_2009': Col(
sym='Yuan et al. (2009)',
unit='',
sub='',
raw='Yuan et al. (2009)',
fmt=None,
latex='$\\mathsf{Yuan\\ et\\ al.\\ (2009)}$',
),
'lucic_mayinger_2010': Col(
sym='Lucic and Mayinger (2010)',
unit='',
sub='',
raw='Lucic and Mayinger (2010)',
fmt=None,
latex='$\\mathsf{Lucic\\ and\\ Mayinger\\ (2010)}$',
),
'kim_park_2011': Col(
sym='Kim and Park (2011)',
unit='',
sub='',
raw='Kim and Park (2011)',
fmt=None,
latex='$\\mathsf{Kim\\ and\\ Park\\ (2011)}$',
),
'al_issa_et_al_2014': Col(
sym='Al Issa et al. (2014)',
unit='',
sub='',
raw='Al Issa et al. (2014)',
fmt=None,
latex='$\\mathsf{Al\\ Issa\\ et\\ al.\\ (2014)}$',
),
'tang_et_al_2016': Col(
sym='Tang et al. (2016)',
unit='',
sub='',
raw='Tang et al. (2016)',
fmt=None,
latex='$\\mathsf{Tang\\ et\\ al.\\ (2016)}$',
),
},
sources=[
LinkedCol(
sym='Frame',
unit='',
sub='',
raw='Frame',
fmt='.0f',
source=Col(
sym='frame',
unit='',
sub='',
raw='frame',
fmt=None,
),
latex='$\\mathsf{Frame}$',
),
LinkedCol(
sym='Contour',
unit='',
sub='',
raw='Contour',
fmt='.0f',
source=Col(
sym='contour',
unit='',
sub='',
raw='contour',
fmt=None,
),
latex='$\\mathsf{Contour}$',
),
LinkedCol(
sym='Bubble',
unit='',
sub='',
raw='Bubble',
fmt='.0f',
source=Col(
sym='particle',
unit='',
sub='',
raw='particle',
fmt=None,
),
latex='$\\mathsf{Bubble}$',
),
],
),
objects=[
PosixPath('/home/runner/work/boilercv/boilercv/docs/data/e230920/objects/objects_2024-07-18T17-44-35.h5'),
],
)
Show code cell source
# Linking
SEARCH_RANGE = 10
"""Pixel range to search for the next bubble."""
MEMORY = 100
"""Frames to remember a bubble."""
length = MEMORY // 2
# Track tuning
Y_SURFACE_THRESHOLD = U.convert(250, "px", "m")
"""Vertical position of bubble centroids considered attached to the surface."""
Y_DEPARTURE_THRESHOLD = U.convert(280, "px", "m")
"""Vertical position of bubble centroids considered to have departed the surface."""
# MINIMUM_LIFETIME = 0.01 # 0.005 # s
# """Minimum bubble lifetime to consider."""
def get_init(ser: Series[float], tail: bool = False) -> float:
"""Get initial value of a series."""
return ser.tail(length).median() if tail else ser.head(length).median()
data.dfs.tracks = preview(
ncol=12,
cols=C.tracks,
df=link(
# ? TrackPy expects certain column names
f=objects.rename(columns={c(): c.source.raw for c in cols_to_link}), # pyright: ignore[reportCallIssue]
search_range=SEARCH_RANGE,
memory=MEMORY,
)
.pipe(rename, cols_to_link) # ? Back to our names
.pipe(C.bub.rename)
.assign(**{
C.bub_visible_frames(): lambda df: (
df.groupby(C.bub(), **GBC)[C.bub()].transform("count") * frames_slice.step
)
})
.pipe(convert, [C.x, C.y, C.diameter, C.radius_of_gyration], U)
.sort_values(
[C.bub_visible_frames(), C.bub(), C.frame()], ascending=[False, True, True]
)
.assign(**{
C.bub(): (lambda df: df.groupby(C.bub(), **GBC).ngroup()),
C.u(): lambda df: get_delta(df, C.u),
C.v(): lambda df: get_delta(df, C.v),
C.distance(): lambda df: linalg.norm(df[[C.x(), C.y()]].abs(), axis=1),
})
.pipe(convert, [C.bub_visible], U),
)
print(f"Found {data.dfs.tracks[C.bub()].nunique()} bubbles")
data.dfs.bubbles = preview(
ncol=12,
cols=C.bubbles,
# ? Find rows corresponding to stagnant or invalid bubbles
# .pipe(lambda df: df[df[C.bub_visible()] > MINIMUM_LIFETIME])
df=data.dfs.tracks.groupby(C.bub(), **GBC)[data.dfs.tracks.columns]
# .apply(lambda df: df[(df[C.v()] > -0.1) & (df[C.v()] < 0.1)])
.apply(
# ? Don't assign any other columns until invalid rows have been filtered out
lambda df: df.assign(**{
"bubble_visible_y": lambda df: df[C.y()].pipe(get_init),
# ? Initial y position is close to the surface
"began": lambda df: df["bubble_visible_y"] > Y_SURFACE_THRESHOLD,
# ? When the bubble gets far enough away from the surface
"departed": lambda df: df[C.y()] < Y_DEPARTURE_THRESHOLD,
})
)
# ? Filter out invalid rows
.pipe(lambda df: df[df["began"] & df["departed"]])
.pipe(limit_group_size, C.bub(), 1)
# ? Groupby again after filtering out invalid rows
.groupby(C.bub(), **GBC)[data.dfs.tracks.columns]
# ? Now columns that depend on the initial row (*.iat[0]) can be assigned
.apply(
lambda df: df.assign(**{
C.bub_time(): lambda df: (
df[C.time_elapsed()] - df[C.time_elapsed()].iat[0]
),
C.bub_lifetime(): lambda df: (
df[C.bub_time()].iat[-1] - df[C.bub_time()].iat[0]
),
})
)
# .pipe(lambda df: df[df[C.bub_time()] > 0])
.groupby(C.bub(), **GBC)[[C.bub_time(), C.bub_lifetime(), *data.dfs.tracks.columns]]
# ? Now columns that depend on the initial row (*.iat[0]) can be assigned
.apply(
lambda df: df.assign(**{
C.bub_t0(): lambda df: df[C.bub_time()].pipe(get_init),
C.bub_x0(): lambda df: df[C.x()].pipe(get_init),
C.bub_y0(): lambda df: df[C.y()].pipe(get_init),
C.bub_d0(): lambda df: df[C.diameter()].pipe(get_init),
C.bub_u0(): lambda df: df[C.u()].pipe(get_init),
C.bub_v0(): lambda df: df[C.v()].pipe(get_init),
C.max_diam(): lambda df: df[C.diameter()].max(),
C.diam_rate_of_change(): lambda df: gradient(
df[C.diameter()], df[C.bub_time()]
),
})
)
.assign(**{"y": lambda df: df[C.y()] - df[C.bub_y0()]})
.pipe(
lambda df: df[
(df[C.bub_d0()] > MIN_BUB_D0) & (df[C.diameter()] > MIN_BUB_DIAMETER)
]
)[[c() for c in C.bubbles]],
)
print(f"{data.dfs.bubbles[C.bub()].nunique()} bubbles remain")
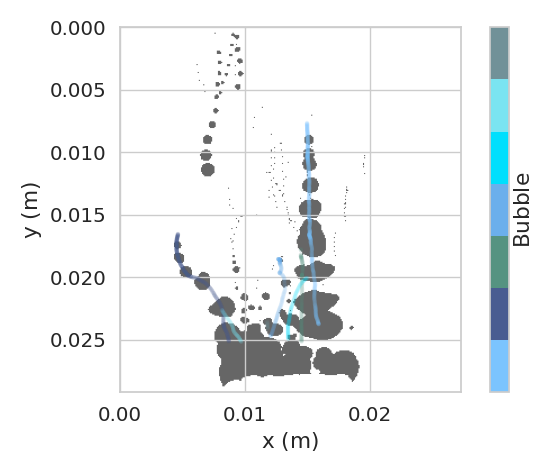
data.plots.bubbles, ax = subplots()
ax.set_xlabel(C.x())
ax.set_ylabel(C.y())
with load_video(
filled_path, slices={FRAME: frames[:: (len(frames) // PREVIEW_FRAME_COUNT)]}
) as video:
composite_video = scale_bool(video).max(FRAME).values
height, width = composite_video.shape[:2]
ax.imshow(
~composite_video, alpha=0.6, extent=(0, width * M_PER_PX, height * M_PER_PX, 0)
)
palette, _ = get_cat_colorbar(
ax, palette=TRACKS_PALETTE, data=data.dfs.bubbles, col=C.bub()
)
scatterplot(
ax=ax,
edgecolor="none",
s=TRACKS_SIZE,
alpha=TRACKS_ALPHA,
x=C.x(),
y=C.y(),
hue=C.bub(),
legend=False,
palette=palette,
data=data.dfs.bubbles.assign(**{c: data.dfs.tracks[c] for c in [C.x(), C.y()]}),
)
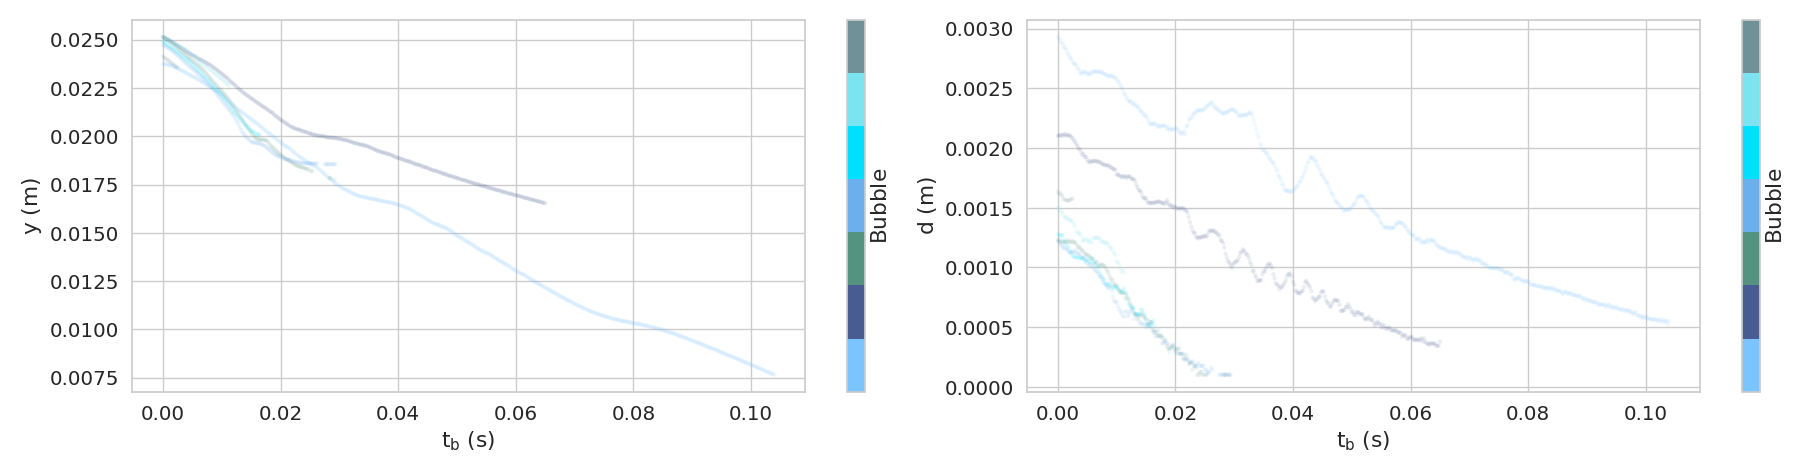
data.plots.multi, axs = subplot_mosaic([[C.y(), C.diameter()]])
scale_figure(data.plots.multi, width=2 * WIDTH_SCALE)
for plot, ax in axs.items():
if plot in [C.v(), C.diam_rate_of_change()]: # pyright: ignore[reportUnnecessaryContains] # TODO: Fix this upstream
ax.set_yscale("log")
palette, _ = get_cat_colorbar(ax, C.bub(), TRACKS_PALETTE, data.dfs.bubbles)
scatterplot(
ax=ax,
edgecolor="none",
s=TRACKS_SIZE,
alpha=TRACKS_ALPHA,
x=C.bub_time(),
y=plot, # pyright: ignore[reportArgumentType] 1.1.356
hue=C.bub(),
legend=False,
palette=palette,
data=data.dfs.bubbles.assign(**{ # pyright: ignore[reportCallIssue]
c: data.dfs.tracks[c] for c in axs if c not in data.dfs.bubbles.columns
}),
)
\(\mathsf{Frame}\) |
\(\mathsf{Contour}\) |
\(\mathsf{t\ \left(s\right)}\) |
\(\mathsf{Bubble}\) |
\(\mathsf{t_{b, vis}\ \left(frames\right)}\) |
\(\mathsf{t_{b, vis}\ \left(s\right)}\) |
\(\mathsf{x\ \left(m\right)}\) |
\(\mathsf{y\ \left(m\right)}\) |
\(\mathsf{u\ \left(m/s\right)}\) |
\(\mathsf{v\ \left(m/s\right)}\) |
\(\mathsf{d\ \left(m\right)}\) |
\(\mathsf{r\ \left(m\right)}\) |
|---|---|---|---|---|---|---|---|---|---|---|---|
0 |
1 |
0.00 |
0 |
500 |
0.104 |
0.0177 |
0.0271 |
0.00 |
0.00 |
0.00202 |
0.000505 |
1 |
1 |
0.000208 |
0 |
500 |
0.104 |
0.0177 |
0.0271 |
0.00 |
0.00 |
0.00202 |
0.000505 |
2 |
1 |
0.000416 |
0 |
500 |
0.104 |
0.0177 |
0.0271 |
0.00504 |
0.0122 |
0.00201 |
0.000503 |
3 |
1 |
0.000625 |
0 |
500 |
0.104 |
0.0177 |
0.0271 |
-0.0355 |
0.0339 |
0.00201 |
0.000502 |
0 |
4 |
0.00 |
1 |
500 |
0.104 |
0.0159 |
0.0238 |
0.00 |
0.00 |
0.00293 |
0.000733 |
1 |
4 |
0.000208 |
1 |
500 |
0.104 |
0.0159 |
0.0238 |
0.0418 |
-0.0414 |
0.00292 |
0.000729 |
2 |
4 |
0.000416 |
1 |
500 |
0.104 |
0.0159 |
0.0237 |
-0.0576 |
-0.0217 |
0.00290 |
0.000726 |
3 |
4 |
0.000625 |
1 |
500 |
0.104 |
0.0159 |
0.0237 |
0.0306 |
-0.0981 |
0.00288 |
0.000721 |
0 |
18 |
0.00 |
2 |
500 |
0.104 |
0.00697 |
0.0114 |
0.00 |
0.00 |
0.00101 |
0.000252 |
1 |
17 |
0.000208 |
2 |
500 |
0.104 |
0.00696 |
0.0114 |
-0.0282 |
-0.0447 |
0.00100 |
0.000251 |
2 |
16 |
0.000416 |
2 |
500 |
0.104 |
0.00696 |
0.0113 |
-0.0338 |
-0.0746 |
0.000991 |
0.000248 |
3 |
14 |
0.000625 |
2 |
500 |
0.104 |
0.00696 |
0.0113 |
0.0218 |
-0.198 |
0.000978 |
0.000244 |
0 |
2 |
0.00 |
3 |
430 |
0.0894 |
0.0104 |
0.0273 |
0.00 |
0.00 |
0.00311 |
0.000779 |
1 |
2 |
0.000208 |
3 |
430 |
0.0894 |
0.0104 |
0.0272 |
0.162 |
-0.0376 |
0.00312 |
0.000781 |
2 |
2 |
0.000416 |
3 |
430 |
0.0894 |
0.0105 |
0.0272 |
0.0736 |
-0.0120 |
0.00312 |
0.000780 |
3 |
2 |
0.000625 |
3 |
430 |
0.0894 |
0.0105 |
0.0272 |
0.00154 |
-0.0453 |
0.00313 |
0.000782 |
Found 35 bubbles
\(\mathsf{Bubble}\) |
\(\mathsf{t_{b}\ \left(s\right)}\) |
\(\mathsf{t_{b,tot}\ \left(s\right)}\) |
\(\mathsf{t_{b0}\ \left(s\right)}\) |
\(\mathsf{d_{b0}\ \left(m\right)}\) |
\(\mathsf{x_{b0}\ \left(m\right)}\) |
\(\mathsf{y_{b0}\ \left(m\right)}\) |
\(\mathsf{u_{b0}\ \left(m/s\right)}\) |
\(\mathsf{v_{b0}\ \left(m/s\right)}\) |
\(\mathsf{d_{b,max}\ \left(m\right)}\) |
\(\mathsf{\dot{d}_{b}\ \left(m/s\right)}\) |
|---|---|---|---|---|---|---|---|---|---|---|
1 |
0.00 |
0.104 |
0.00510 |
0.00264 |
0.0157 |
0.0231 |
-0.0350 |
-0.160 |
0.00293 |
-0.0845 |
1 |
0.000208 |
0.104 |
0.00510 |
0.00264 |
0.0157 |
0.0231 |
-0.0350 |
-0.160 |
0.00293 |
-0.0699 |
1 |
0.000416 |
0.104 |
0.00510 |
0.00264 |
0.0157 |
0.0231 |
-0.0350 |
-0.160 |
0.00293 |
-0.0764 |
1 |
0.000625 |
0.104 |
0.00510 |
0.00264 |
0.0157 |
0.0231 |
-0.0350 |
-0.160 |
0.00293 |
-0.0810 |
4 |
0.00 |
0.0650 |
0.00510 |
0.00190 |
0.00846 |
0.0242 |
-0.0494 |
-0.186 |
0.00212 |
0.0176 |
4 |
0.000208 |
0.0650 |
0.00510 |
0.00190 |
0.00846 |
0.0242 |
-0.0494 |
-0.186 |
0.00212 |
0.0147 |
4 |
0.000416 |
0.0650 |
0.00510 |
0.00190 |
0.00846 |
0.0242 |
-0.0494 |
-0.186 |
0.00212 |
0.00293 |
4 |
0.000624 |
0.0650 |
0.00510 |
0.00190 |
0.00846 |
0.0242 |
-0.0494 |
-0.186 |
0.00212 |
-0.0146 |
7 |
0.00 |
0.0292 |
0.00510 |
0.00110 |
0.0146 |
0.0239 |
-0.000972 |
-0.289 |
0.00123 |
-0.0400 |
7 |
0.000209 |
0.0292 |
0.00510 |
0.00110 |
0.0146 |
0.0239 |
-0.000972 |
-0.289 |
0.00123 |
-0.0504 |
7 |
0.000417 |
0.0292 |
0.00510 |
0.00110 |
0.0146 |
0.0239 |
-0.000972 |
-0.289 |
0.00123 |
-0.0101 |
7 |
0.000625 |
0.0292 |
0.00510 |
0.00110 |
0.0146 |
0.0239 |
-0.000972 |
-0.289 |
0.00123 |
-0.0102 |
8 |
0.00 |
0.0294 |
0.00510 |
0.00103 |
0.0125 |
0.0235 |
0.0875 |
-0.282 |
0.00122 |
0.0406 |
8 |
0.000208 |
0.0294 |
0.00510 |
0.00103 |
0.0125 |
0.0235 |
0.0875 |
-0.282 |
0.00122 |
-0.0410 |
8 |
0.000416 |
0.0294 |
0.00510 |
0.00103 |
0.0125 |
0.0235 |
0.0875 |
-0.282 |
0.00122 |
-0.0924 |
8 |
0.000624 |
0.0294 |
0.00510 |
0.00103 |
0.0125 |
0.0235 |
0.0875 |
-0.282 |
0.00122 |
-0.0624 |
7 bubbles remain
Show code cell source
data.dfs.dst = preview(
    cols=C.dests,
    df=data.dfs.bubbles.assign(**{
        C.bub_reynolds(): reynolds(
            velocity=abs(data.dfs.tracks[C.v()]),
            characteristic_length=data.dfs.tracks[C.diameter()],
            kinematic_viscosity=constants["liquid_kinematic_viscosity"],
        ),
        C.bub_reynolds0(): lambda df: df.groupby(C.bub(), **GBC)[
            C.bub_reynolds()
        ].transform(get_init),
        C.bub_fourier(): fourier(
            initial_bubble_diameter=data.dfs.bubbles[C.bub_d0()],
            liquid_thermal_diffusivity=constants["liquid_thermal_diffusivity"],
            time=data.dfs.bubbles[C.bub_time()],
        ),
        C.bub_nusselt(): nusselt(  # Nu_c
            heat_transfer_coefficient=-(
                2
                * VAPOR_DENSITY
                * LATENT_HEAT_OF_VAPORIZATION
                / subcooling
                * data.dfs.bubbles[C.diam_rate_of_change()]
            ),
            characteristic_length=data.dfs.tracks[C.diameter()] / 2,
            thermal_conductivity=LIQUID_THERMAL_CONDUCTIVITY,
        ),
        C.bub_beta(): (lambda df: data.dfs.tracks[C.diameter()] / df[C.bub_d0()]),
    }).pipe(lambda df: df[df[C.bub_fourier()] < MAX_FOURIER])[[c() for c in C.dests]],
)
print(f"{data.dfs.dst[C.bub()].nunique()} bubbles remain")
data.dfs.beta = preview(
    cols=C.corr_beta, df=data.dfs.dst.pipe(get_corrs, kind="beta"), ncol=6
)[[c() for c in C.corr_beta]]
data.dfs.nusselt = preview(
    cols=C.corr_nusselt, df=data.dfs.dst.pipe(get_corrs, kind="nusselt"), ncol=6
)[[c() for c in C.corr_nusselt]]
data.dfs.beta_err = preview(
    cols=C.corr_beta, df=data.dfs.beta.pipe(get_error, kind="beta"), ncol=6
)[[c() for c in C.err_beta]]
data.dfs.nusselt_err = preview(
    cols=C.corr_nusselt, df=data.dfs.nusselt.pipe(get_error, kind="nusselt"), ncol=6
)[[c() for c in C.err_nusselt]]
\(\mathsf{Bubble}\) |
\(\mathsf{Re_{b}}\) |
\(\mathsf{Re_{b0}}\) |
\(\mathsf{Fo_{b}}\) |
\(\mathsf{Nu_{c}}\) |
\(\mathsf{β}\) |
|---|---|---|---|---|---|
1 |
0.00 |
1.41e+03 |
0.00 |
354. |
1.11 |
1 |
402. |
1.41e+03 |
4.99e-06 |
290. |
1.10 |
1 |
210. |
1.41e+03 |
9.98e-06 |
317. |
1.10 |
1 |
943. |
1.41e+03 |
1.50e-05 |
333. |
1.09 |
4 |
1.57e+03 |
1.24e+03 |
0.00 |
-52.8 |
1.11 |
4 |
540. |
1.24e+03 |
9.63e-06 |
-44.1 |
1.11 |
4 |
1.23e+03 |
1.24e+03 |
1.93e-05 |
-8.82 |
1.11 |
4 |
1.06e+03 |
1.24e+03 |
2.89e-05 |
43.9 |
1.11 |
7 |
732. |
1.02e+03 |
0.00 |
70.4 |
1.12 |
7 |
999. |
1.02e+03 |
2.87e-05 |
88.2 |
1.11 |
7 |
549. |
1.02e+03 |
5.72e-05 |
17.5 |
1.10 |
7 |
1.09e+03 |
1.02e+03 |
8.57e-05 |
17.8 |
1.11 |
8 |
0.00 |
956. |
0.00 |
-70.3 |
1.17 |
8 |
617. |
956. |
3.25e-05 |
71.5 |
1.18 |
8 |
775. |
956. |
6.50e-05 |
158. |
1.16 |
8 |
728. |
956. |
9.76e-05 |
105. |
1.15 |
7 bubbles remain
\(\mathsf{Bubble}\) |
\(\mathsf{Fo_{b}}\) |
\(\mathsf{β}\) |
\(\mathsf{Florschuetz\ and\ Chao\ (1965)}\) |
\(\mathsf{Fitted\ Florschuetz\ and\ Chao\ (1965)}\) |
\(\mathsf{Isenberg\ and\ Sideman\ (1970)}\) |
|---|---|---|---|---|---|
1 |
0.00 |
1.11 |
1.00 |
1.00 |
1.00 |
1 |
4.99e-06 |
1.10 |
0.979 |
0.954 |
0.999 |
1 |
9.98e-06 |
1.10 |
0.970 |
0.938 |
0.998 |
1 |
1.50e-05 |
1.09 |
0.963 |
0.926 |
0.997 |
4 |
0.00 |
1.11 |
1.00 |
1.00 |
1.00 |
4 |
9.63e-06 |
1.11 |
0.971 |
0.939 |
0.998 |
4 |
1.93e-05 |
1.11 |
0.958 |
0.917 |
0.996 |
4 |
2.89e-05 |
1.11 |
0.949 |
0.901 |
0.994 |
7 |
0.00 |
1.12 |
1.00 |
1.00 |
1.00 |
7 |
2.87e-05 |
1.11 |
0.949 |
0.901 |
0.995 |
7 |
5.72e-05 |
1.10 |
0.928 |
0.866 |
0.989 |
7 |
8.57e-05 |
1.11 |
0.912 |
0.839 |
0.984 |
8 |
0.00 |
1.17 |
1.00 |
1.00 |
1.00 |
8 |
3.25e-05 |
1.18 |
0.946 |
0.895 |
0.994 |
8 |
6.50e-05 |
1.16 |
0.924 |
0.858 |
0.988 |
8 |
9.76e-05 |
1.15 |
0.906 |
0.830 |
0.983 |
\(\mathsf{Bubble}\) |
\(\mathsf{Fo_{b}}\) |
\(\mathsf{Nu_{c}}\) |
\(\mathsf{Florschuetz\ and\ Chao\ (1965)}\) |
\(\mathsf{Fitted\ Florschuetz\ and\ Chao\ (1965)}\) |
\(\mathsf{Isenberg\ and\ Sideman\ (1970)}\) |
|---|---|---|---|---|---|
1 |
0.00 |
354. |
-53.2 |
-53.2 |
0.00 |
1 |
4.99e-06 |
290. |
-56.3 |
-56.3 |
13.8 |
1 |
9.98e-06 |
317. |
-58.5 |
-58.5 |
9.94 |
1 |
1.50e-05 |
333. |
-62.9 |
-62.9 |
21.1 |
4 |
0.00 |
-52.8 |
-55.3 |
-55.3 |
27.2 |
4 |
9.63e-06 |
-44.1 |
-54.4 |
-54.4 |
15.9 |
4 |
1.93e-05 |
-8.82 |
-53.9 |
-53.9 |
24.0 |
4 |
2.89e-05 |
43.9 |
-54.2 |
-54.2 |
22.4 |
7 |
0.00 |
70.4 |
-50.8 |
-50.8 |
18.6 |
7 |
2.87e-05 |
88.2 |
-53.9 |
-53.9 |
21.7 |
7 |
5.72e-05 |
17.5 |
-59.6 |
-59.6 |
16.1 |
7 |
8.57e-05 |
17.8 |
-55.6 |
-55.6 |
22.6 |
8 |
0.00 |
-70.3 |
-35.9 |
-35.9 |
0.00 |
8 |
3.25e-05 |
71.5 |
-34.6 |
-34.6 |
17.0 |
8 |
6.50e-05 |
158. |
-39.1 |
-39.1 |
19.1 |
8 |
9.76e-05 |
105. |
-42.0 |
-42.0 |
18.5 |
\(\mathsf{Bubble}\) |
\(\mathsf{Fo_{b}}\) |
\(\mathsf{β}\) |
\(\mathsf{Florschuetz\ and\ Chao\ (1965)}\) |
\(\mathsf{Fitted\ Florschuetz\ and\ Chao\ (1965)}\) |
\(\mathsf{Isenberg\ and\ Sideman\ (1970)}\) |
|---|---|---|---|---|---|
1 |
0.00 |
1.11 |
0.111 |
0.111 |
0.111 |
1 |
4.99e-06 |
1.10 |
0.129 |
0.158 |
0.106 |
1 |
9.98e-06 |
1.10 |
0.134 |
0.173 |
0.103 |
1 |
1.50e-05 |
1.09 |
0.134 |
0.180 |
0.0963 |
4 |
0.00 |
1.11 |
0.107 |
0.107 |
0.107 |
4 |
9.63e-06 |
1.11 |
0.142 |
0.181 |
0.111 |
4 |
1.93e-05 |
1.11 |
0.158 |
0.211 |
0.114 |
4 |
2.89e-05 |
1.11 |
0.169 |
0.232 |
0.116 |
7 |
0.00 |
1.12 |
0.118 |
0.118 |
0.118 |
7 |
2.87e-05 |
1.11 |
0.169 |
0.232 |
0.116 |
7 |
5.72e-05 |
1.10 |
0.183 |
0.269 |
0.110 |
7 |
8.57e-05 |
1.11 |
0.212 |
0.318 |
0.124 |
8 |
0.00 |
1.17 |
0.175 |
0.175 |
0.175 |
8 |
3.25e-05 |
1.18 |
0.250 |
0.321 |
0.190 |
8 |
6.50e-05 |
1.16 |
0.254 |
0.350 |
0.172 |
8 |
9.76e-05 |
1.15 |
0.264 |
0.381 |
0.166 |
\(\mathsf{Bubble}\) |
\(\mathsf{Fo_{b}}\) |
\(\mathsf{Nu_{c}}\) |
\(\mathsf{Florschuetz\ and\ Chao\ (1965)}\) |
\(\mathsf{Fitted\ Florschuetz\ and\ Chao\ (1965)}\) |
\(\mathsf{Isenberg\ and\ Sideman\ (1970)}\) |
|---|---|---|---|---|---|
1 |
0.00 |
354. |
-7.64 |
-7.64 |
inf |
1 |
4.99e-06 |
290. |
-6.16 |
-6.16 |
20.1 |
1 |
9.98e-06 |
317. |
-6.41 |
-6.41 |
30.9 |
1 |
1.50e-05 |
333. |
-6.30 |
-6.30 |
14.8 |
4 |
0.00 |
-52.8 |
-0.0454 |
-0.0454 |
2.95 |
4 |
9.63e-06 |
-44.1 |
-0.191 |
-0.191 |
3.77 |
4 |
1.93e-05 |
-8.82 |
-0.836 |
-0.836 |
1.37 |
4 |
2.89e-05 |
43.9 |
-1.81 |
-1.81 |
0.963 |
7 |
0.00 |
70.4 |
-2.39 |
-2.39 |
2.79 |
7 |
2.87e-05 |
88.2 |
-2.64 |
-2.64 |
3.07 |
7 |
5.72e-05 |
17.5 |
-1.29 |
-1.29 |
0.0880 |
7 |
8.57e-05 |
17.8 |
-1.32 |
-1.32 |
0.215 |
8 |
0.00 |
-70.3 |
-0.956 |
-0.956 |
inf |
8 |
3.25e-05 |
71.5 |
-3.07 |
-3.07 |
3.20 |
8 |
6.50e-05 |
158. |
-5.04 |
-5.04 |
7.27 |
8 |
9.76e-05 |
105. |
-3.51 |
-3.51 |
4.70 |
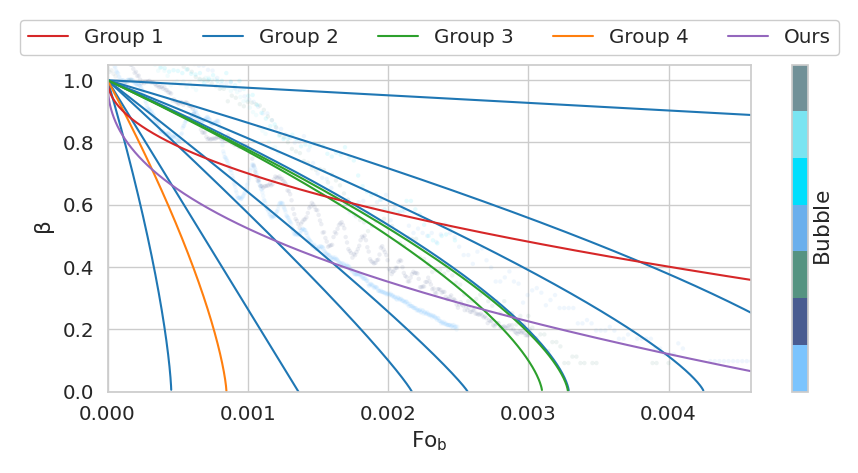
Show code cell source
cols = [c() for c in C.corr.values()]
data.plots.beta, ax = subplots()
palette, _ = get_cat_colorbar(
    ax, palette=TRACKS_PALETTE, data=data.dfs.dst, col=C.bub()
)
ax.set_xlim(0, min(MAX_FOURIER, data.dfs.dst[C.bub_fourier()].max()))
ax.set_ylim(0, MAX_BETA)
scatterplot(
    ax=ax,
    edgecolor="none",
    alpha=TRACKS_ALPHA,
    s=TRACKS_SIZE,
    x=C.bub_fourier(),
    y=C.bub_beta(),
    hue=C.bub(),
    legend=False,
    palette=palette,
    data=data.dfs.dst,
)
beta = get_corrs(
    DataFrame({
        C.bub_fourier(): logspace(
            stop=log10(MAX_FOURIER), start=log10(MAX_FOURIER) - 4, num=int(1e4)
        ),
        C.bub_reynolds0(): data.dfs.dst[C.bub_reynolds0()].median(),
        C.bub_reynolds(): data.dfs.dst[C.bub_reynolds()].median(),
    }),
    "beta",
)
lineplot(
    ax=ax,
    palette=CORRELATIONS_PALETTE,
    hue_order=GROUP_DRAW_ORDER,
    x=C.bub_fourier(),
    y=C.bub_beta(),
    dashes=False,
    style="Correlation",
    hue="Group",
    errorbar=None,
    data=(
        melt(
            beta.set_index(C.bub_fourier())[cols],
            var_name="Correlation",
            value_name=C.bub_beta(),
            value_vars=cols,
            ignore_index=False,
        )
        .assign(**{
            C.bub_fourier(): lambda df: df.index,
            "Group": lambda df: df["Correlation"].map(groups),
        })
        .reset_index(drop=True)
        .sort_values("Group")
    ),
)
set_group_legend(data.plots.beta, ax)
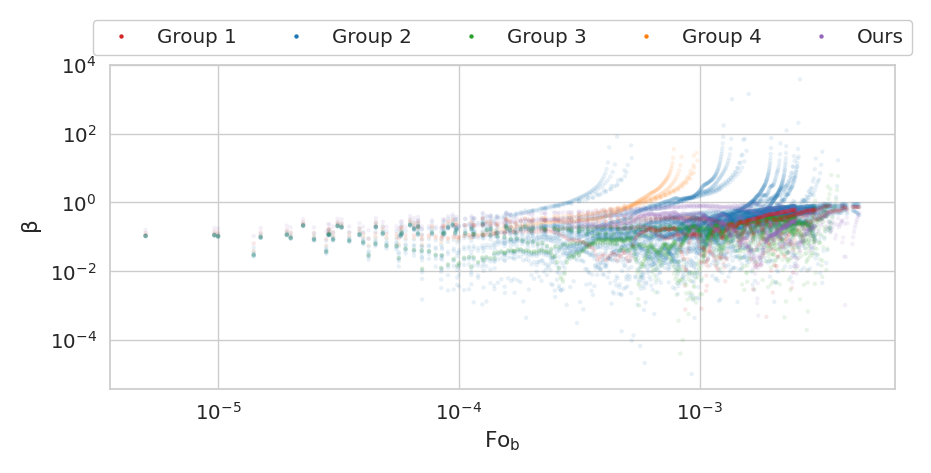
Show code cell source
data.plots.beta_err, ax = subplots()
ax.set_ylabel(C.bub_beta())
ax.set_xscale("log")
ax.set_yscale("log")
scatterplot(
    ax=ax,
    edgecolor="none",
    hue_order=GROUP_DRAW_ORDER,
    s=TRACKS_SIZE,
    alpha=TRACKS_ALPHA,
    palette="tab10",
    x=C.bub_fourier(),
    y=C.bub_beta(),
    hue="Group",
    data=(
        melt(
            data.dfs.beta_err.set_index(C.bub_fourier())[
                [c() for c in C.corr.values()]
            ],
            var_name="Correlation",
            value_name=C.bub_beta(),
            value_vars=[c() for c in C.corr.values()],
            ignore_index=False,
        )
        .assign(**{
            C.bub_fourier(): lambda df: df.index,
            "Group": lambda df: df["Correlation"].map(groups),
        })
        .reset_index(drop=True)
        .sort_values("Group", key=GROUP_SORTER)
    ),
)
set_group_legend(data.plots.beta_err, ax)
Show code cell source
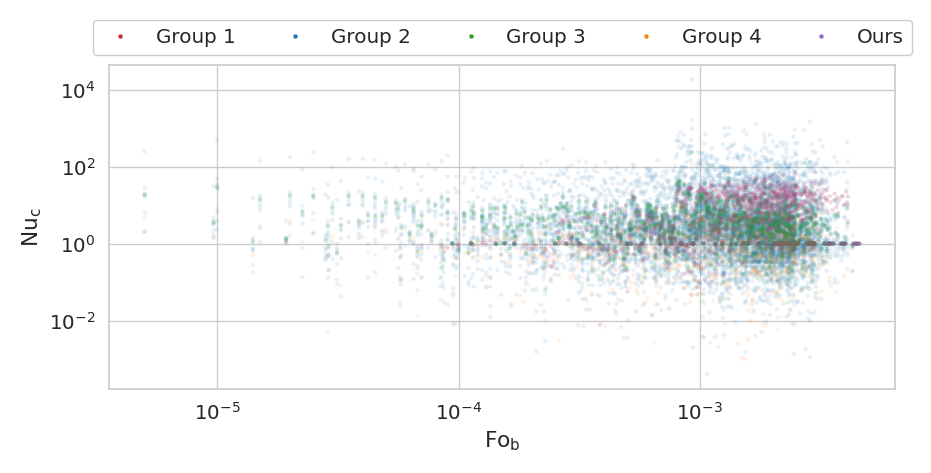
data.plots.nusselt_err, ax = subplots()
ax.set_ylabel(C.bub_nusselt())
ax.set_xscale("log")
ax.set_yscale("log")
scatterplot(
    ax=ax,
    edgecolor="none",
    hue_order=GROUP_DRAW_ORDER,
    s=TRACKS_SIZE,
    alpha=TRACKS_ALPHA,
    palette="tab10",
    x=C.bub_fourier(),
    y=C.bub_nusselt(),
    hue="Group",
    data=(
        melt(
            data.dfs.nusselt_err.set_index(C.bub_fourier())[
                [c() for c in C.corr.values()]
            ],
            var_name="Correlation",
            value_name=C.bub_nusselt(),
            value_vars=[c() for c in C.corr.values()],
            ignore_index=False,
        )
        .assign(**{
            C.bub_fourier(): lambda df: df.index,
            "Group": lambda df: df["Correlation"].map(groups),
        })
        .reset_index(drop=True)
        .sort_values("Group", key=GROUP_SORTER)
    ),
)
set_group_legend(data.plots.nusselt_err, ax)
Show code cell source
pivoted_beta_err = (
    melt(
        data.dfs.beta.groupby(C.bub(), **GBC)[[c() for c in C.corr.values()]]
        .apply(lambda df: df.sum() / len(df))
        .set_index(C.bub()),
        var_name="Correlation",
        value_name=C.bub_beta(),
        value_vars=[c() for c in C.corr.values()],
        ignore_index=False,
    )
    .assign(**{
        C.bub(): lambda df: df.index,
        "Group": lambda df: df["Correlation"].map(groups),
    })
    .reset_index(drop=True)
    .sort_values("Group")
)
pivoted_nusselt_err = (
    melt(
        data.dfs.nusselt.groupby(C.bub(), **GBC)[[c() for c in C.corr.values()]]
        .apply(lambda df: df.sum() / len(df))
        .set_index(C.bub()),
        var_name="Correlation",
        value_name=C.bub_nusselt(),
        value_vars=[c() for c in C.corr.values()],
        ignore_index=False,
    )
    .assign(**{
        C.bub(): lambda df: df.index,
        "Group": lambda df: df["Correlation"].map(groups),
    })
    .reset_index(drop=True)
    .sort_values("Group")
)
data.plots.mae, ax = subplots()
ax.set_xlim(0, 1)
ax.set_yscale("log")
scatterplot(
    ax=ax,
    edgecolor="none",
    hue_order=GROUP_DRAW_ORDER,
    s=TRACKS_SIZE,
    alpha=TRACKS_ALPHA * 4,
    palette="tab10",
    x=C.bub_beta(),
    y=C.bub_nusselt(),
    hue="Group",
    data=(
        merge_ordered(
            pivoted_beta_err.drop(columns="Group").set_index(C.bub()),
            pivoted_nusselt_err.drop(columns="Group").set_index(C.bub()),
            on=[C.bub(), "Correlation"],
        )
        .assign(**{"Group": lambda df: df["Correlation"].map(groups)})
        .sort_values("Group", key=GROUP_SORTER)
    ),
)
set_group_legend(data.plots.mae, ax)
