Get thermal data#
Show code cell source
from __future__ import annotations

from collections.abc import Iterable

from boilercore.fits import fit_from_params
from boilercore.models.geometry import GEOMETRY
from boilercore.paths import ISOLIKE, dt_fromisolike
from boilercv_dev.docs.nbs import get_mode, init
from boilercv_pipeline.models.column import Col, convert, rename
from boilercv_pipeline.stages.find_objects import FindObjects
from boilercv_pipeline.stages.get_thermal_data import GetThermalData as Params
from boilercv_pipeline.units import U
from devtools import pprint
from matplotlib.figure import Figure
from matplotlib.pyplot import subplots
from pandas import DataFrame, Series, concat, read_csv, read_hdf
from seaborn import lineplot, scatterplot

PARAMS = None
"""Notebook stage parameters."""
MODE = get_mode()
"""Notebook execution mode."""
Params.hide()
Show code cell source
context = init(mode=MODE)
if isinstance(PARAMS, str):  # pyright: ignore[reportUnnecessaryIsInstance]
    params = Params.model_validate_json(PARAMS)
    context = params.context
else:
    params = Params(context=context)
params.set_display_options()
data = params.data
C = params.cols

contours = FindObjects(context=context).contours

HIGHLIGHTS = ["2024-07-18T17-07-13", "2024-07-18T18-04-05", "2024-07-18T18-49-55"]
"""Chosen datasets to higlight in the dissertation."""
WIDTH_SCALE = 1.257
"""Width to scale plots by."""
HEIGHT_SCALE = 1.000
"""Width to scale plots by."""


def scale_figure(fig: Figure, width: float = WIDTH_SCALE, height: float = HEIGHT_SCALE):
    """Scale up figure size."""
    fig.set_figwidth(width * fig.get_figwidth())
    fig.set_figheight(height * fig.get_figheight())


def fit(df: DataFrame, flux: Col, sample_temps: Iterable[Col]) -> DataFrame:
    """Fit model function across sample temperatures."""
    models = params.fit.get_models(params.deps.modelfunctions)[0]

    def apply_fit(df: DataFrame) -> Series[float]:
        return df.loc[:, [c() for c in sample_temps]].apply(
            lambda ser: fit(ser)[0]["q_s"], axis="columns"
        )

    def fit(ser: Series[float]) -> tuple[dict[str, float], dict[str, float]]:
        return fit_from_params(models, params.fit, GEOMETRY.rods["R"], ser)

    return df.assign(**{flux(): apply_fit})


pprint(params)
Show code cell source
sources = [c.source.raw for c in C.sources]
data.dfs.src = params.preview(
    cols=C.sources,
    df=concat([
        read_csv(
            p,
            usecols=[C.time.source.raw, *sources],
            parse_dates=[C.time.source.raw],
            index_col=C.time.source.raw,
        )
        for p in params.deps.thermal_paths
    ])
    .reset_index()
    .pipe(rename, C.sources)
    .assign(**{
        C.time_elapsed(): lambda df: (
            (df[C.index()] - df[C.index()][0]).dt.total_seconds()
        )
    }),
)
\(\mathsf{Time}\) |
\(\mathsf{T_{w3}\ \left(°C\right)}\) |
\(\mathsf{T_{w4}\ \left(°C\right)}\) |
\(\mathsf{T_{1}\ \left(°C\right)}\) |
\(\mathsf{T_{2}\ \left(°C\right)}\) |
\(\mathsf{T_{3}\ \left(°C\right)}\) |
\(\mathsf{T_{4}\ \left(°C\right)}\) |
\(\mathsf{T_{5}\ \left(°C\right)}\) |
\(\mathsf{T_{s}\ \left(°C\right)}\) |
|---|---|---|---|---|---|---|---|---|
2024-07-18 16:57:59.835356 |
98.0 |
97.8 |
128. |
124. |
121. |
117. |
108. |
102. |
2024-07-18 16:58:02.729356 |
98.0 |
97.8 |
128. |
124. |
121. |
117. |
108. |
103. |
2024-07-18 16:58:04.732189 |
98.1 |
97.8 |
128. |
124. |
121. |
117. |
108. |
103. |
2024-07-18 16:58:06.724565 |
98.1 |
97.8 |
128. |
124. |
121. |
117. |
108. |
103. |
2024-07-18 16:58:08.734172 |
98.1 |
97.8 |
128. |
124. |
121. |
117. |
108. |
103. |
Show code cell source
only_dests = [C.time, *[c for c in C.dests if c not in C.sources]]
data.dfs.dst = params.preview(
    cols=only_dests,
    df=(
        DataFrame(read_hdf(params.outs.df))
        if params.load_src_from_outs and params.outs.df.exists()
        else (
            data.dfs.src.set_index(C.index())
            .resample("s")
            .median()
            .assign(**{
                C.video(): lambda df: df.index.isin(
                    df.index[
                        df.index.get_indexer(
                            [
                                dt_fromisolike(match)
                                for p in contours
                                if (match := ISOLIKE.search(p.stem))
                            ],
                            method="nearest",
                        )
                    ]
                )
            })
            .assign(**{
                C.highlight(): lambda df: df.index.isin(
                    df.index[
                        df.index.get_indexer(
                            [
                                dt_fromisolike(match)
                                for highlight in HIGHLIGHTS
                                if (match := ISOLIKE.search(highlight))
                            ],
                            method="nearest",
                        )
                    ]
                )
            })
            .reset_index()
            .ffill()
            .assign(**{
                C.water_temp(): lambda df: df[[c() for c in C.water_temps]].mean(
                    axis="columns"
                ),
                C.boiling(): lambda df: df[C.water_temp()].max(),
                C.superheat(): lambda df: df[C.surface_temp()] - df[C.boiling()],
                C.subcool(): lambda df: df[C.boiling()] - df[C.water_temp()],
            })
            .pipe(fit, flux=C.flux.source, sample_temps=C.sample_temps)
            .pipe(convert, cols=[C.time_elapsed_min, C.flux], ureg=U)
        )
    )[[c() for c in C.dests]],
)
\(\mathsf{Time}\) |
\(\mathsf{t\ \left(s\right)}\) |
\(\mathsf{t\ \left(min\right)}\) |
\(\mathsf{T_{w}\ \left(°C\right)}\) |
\(\mathsf{ΔT_{super}\ \left(K\right)}\) |
\(\mathsf{ΔT_{sub}\ \left(K\right)}\) |
\(\mathsf{q''\ \left(W/cm^2\right)}\) |
\(\mathsf{T_{sat}\ \left(°C\right)}\) |
\(\mathsf{Video}\) |
\(\mathsf{Highlight}\) |
|---|---|---|---|---|---|---|---|---|---|
2024-07-18 16:57:59 |
0.00 |
0.00 |
97.9 |
4.03 |
0.378 |
7.91 |
98.3 |
False |
False |
2024-07-18 16:58:00 |
0.00 |
0.00 |
97.9 |
4.03 |
0.378 |
7.91 |
98.3 |
False |
False |
2024-07-18 16:58:01 |
0.00 |
0.00 |
97.9 |
4.03 |
0.378 |
7.91 |
98.3 |
False |
False |
2024-07-18 16:58:02 |
2.89 |
0.0482 |
97.9 |
4.30 |
0.346 |
7.87 |
98.3 |
False |
False |
2024-07-18 16:58:03 |
2.89 |
0.0482 |
97.9 |
4.30 |
0.346 |
7.87 |
98.3 |
False |
False |
Show code cell source
data.dfs.resampled = params.preview(
    cols=only_dests,
    df=(
        data.dfs.dst.set_index(C.index())
        .resample("20s")
        .agg({
            **dict.fromkeys([c() for c in C.dests if c != C.index], "median"),
            C.video(): "max",
            C.highlight(): "max",
        })
        .reset_index()
    ),
)
\(\mathsf{Time}\) |
\(\mathsf{t\ \left(s\right)}\) |
\(\mathsf{t\ \left(min\right)}\) |
\(\mathsf{T_{w}\ \left(°C\right)}\) |
\(\mathsf{ΔT_{super}\ \left(K\right)}\) |
\(\mathsf{ΔT_{sub}\ \left(K\right)}\) |
\(\mathsf{q''\ \left(W/cm^2\right)}\) |
\(\mathsf{T_{sat}\ \left(°C\right)}\) |
\(\mathsf{Video}\) |
\(\mathsf{Highlight}\) |
|---|---|---|---|---|---|---|---|---|---|
2024-07-18 16:57:40 |
0.00 |
0.00 |
97.9 |
4.03 |
0.378 |
7.91 |
98.3 |
False |
False |
2024-07-18 16:58:00 |
9.90 |
0.165 |
97.9 |
4.52 |
0.325 |
7.85 |
98.3 |
False |
False |
2024-07-18 16:58:20 |
29.9 |
0.499 |
97.9 |
4.44 |
0.335 |
7.88 |
98.3 |
False |
False |
2024-07-18 16:58:40 |
49.9 |
0.832 |
97.9 |
4.59 |
0.405 |
7.89 |
98.3 |
False |
False |
2024-07-18 16:59:00 |
70.0 |
1.17 |
97.9 |
4.84 |
0.415 |
7.82 |
98.3 |
False |
False |
Show code cell source
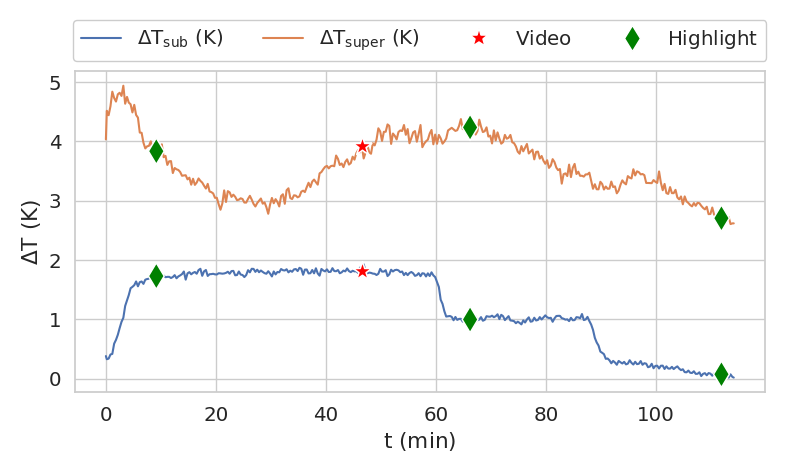
data.plots.subcool_superheat, ax = subplots()
lineplot(
    ax=ax,
    zorder=1,
    data=data.dfs.resampled.set_index(C.time_elapsed_min())[
        [C.subcool(), C.superheat()]
    ],
    dashes=False,
    errorbar=None,
)
scatterplot(
    ax=ax,
    s=10 * params.marker_scale,
    markers={C.video(): "*"},
    palette={C.video(): "red"},
    data=data.dfs.resampled.assign(**{
        C.video(): lambda df: df[df[C.video()]][C.superheat()]
    }).set_index(C.time_elapsed_min())[[C.video()]],
)
scatterplot(
    ax=ax,
    s=10 * params.marker_scale,
    markers={C.video(): "*"},
    palette={C.video(): "red"},
    data=data.dfs.resampled.assign(**{
        C.video(): lambda df: df[df[C.video()]][C.subcool()]
    }).set_index(C.time_elapsed_min())[[C.video()]],
    legend=False,
)
scatterplot(
    ax=ax,
    s=9 * params.marker_scale,
    markers={C.highlight(): "d"},
    palette={C.highlight(): "green"},
    data=data.dfs.resampled.assign(**{
        C.highlight(): lambda df: df[df[C.highlight()]][C.superheat()]
    }).set_index(C.time_elapsed_min())[[C.highlight()]],
)
scatterplot(
    ax=ax,
    s=9 * params.marker_scale,
    markers={C.highlight(): "d"},
    palette={C.highlight(): "green"},
    data=data.dfs.resampled.assign(**{
        C.highlight(): lambda df: df[df[C.highlight()]][C.subcool()]
    }).set_index(C.time_elapsed_min())[[C.highlight()]],
    legend=False,
)

ax.set_ylabel(C.subcool.no_sub())
params.move_legend(ax, ncol=4)
scale_figure(ax.get_figure())

Show code cell source
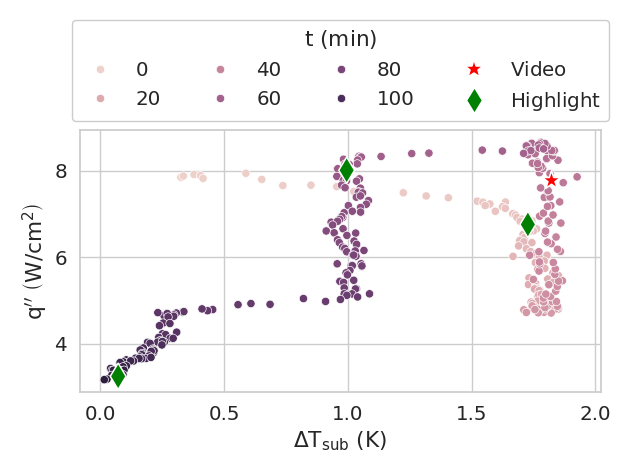
data.plots.subcool, ax = subplots()
scatterplot(
    ax=ax, data=data.dfs.resampled, x=C.subcool(), y=C.flux(), hue=C.time_elapsed_min()
)
scatterplot(
    ax=ax,
    s=10 * params.marker_scale,
    markers={C.video(): "*"},
    palette={C.video(): "red"},
    data=data.dfs.resampled.assign(**{
        C.video(): lambda df: df[df[C.video()]][C.flux()]
    }).set_index(C.subcool())[[C.video()]],
)
scatterplot(
    ax=ax,
    s=9 * params.marker_scale,
    markers={C.highlight(): "d"},
    palette={C.highlight(): "green"},
    data=data.dfs.resampled.assign(**{
        C.highlight(): lambda df: df[df[C.highlight()]][C.flux()]
    }).set_index(C.subcool())[[C.highlight()]],
)
ax.get_legend().set_title(C.time_elapsed_min())  # pyright: ignore[reportOptionalMemberAccess]
params.move_legend(ax, ncol=4)

Show code cell source
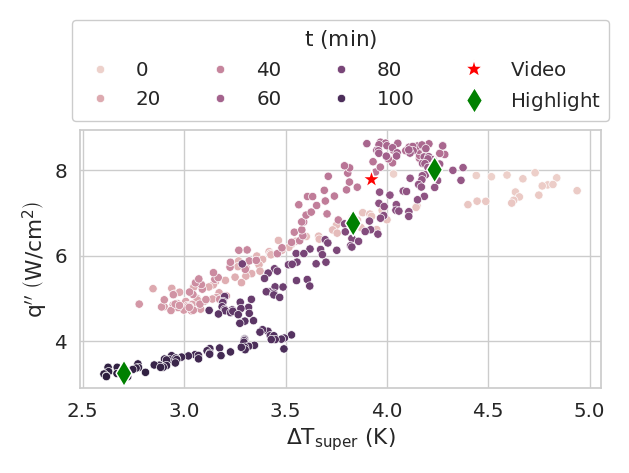
data.plots.superheat, ax = subplots()
scatterplot(
    ax=ax,
    data=data.dfs.resampled,
    x=C.superheat(),
    y=C.flux(),
    hue=C.time_elapsed_min(),
)
scatterplot(
    ax=ax,
    s=10 * params.marker_scale,
    markers={C.video(): "*"},
    palette={C.video(): "red"},
    data=data.dfs.resampled.assign(**{
        C.video(): lambda df: df[df[C.video()]][C.flux()]
    }).set_index(C.superheat())[[C.video()]],
)
scatterplot(
    ax=ax,
    s=9 * params.marker_scale,
    markers={C.highlight(): "d"},
    palette={C.highlight(): "green"},
    data=data.dfs.resampled.assign(**{
        C.highlight(): lambda df: df[df[C.highlight()]][C.flux()]
    }).set_index(C.superheat())[[C.highlight()]],
)
ax.get_legend().set_title(C.time_elapsed_min())  # pyright: ignore[reportOptionalMemberAccess]
params.move_legend(ax, ncol=4)
